2025: A renewable energy year in review
Each month in our newsletter we share how electricity is being generated across Aotearoa. Over time, these snapshots help to build a bigger picture. Looking back at 2025, that picture is one of contrast: periods of strain followed by a great run of renewable abundance.

Renewable generation by month in 2025
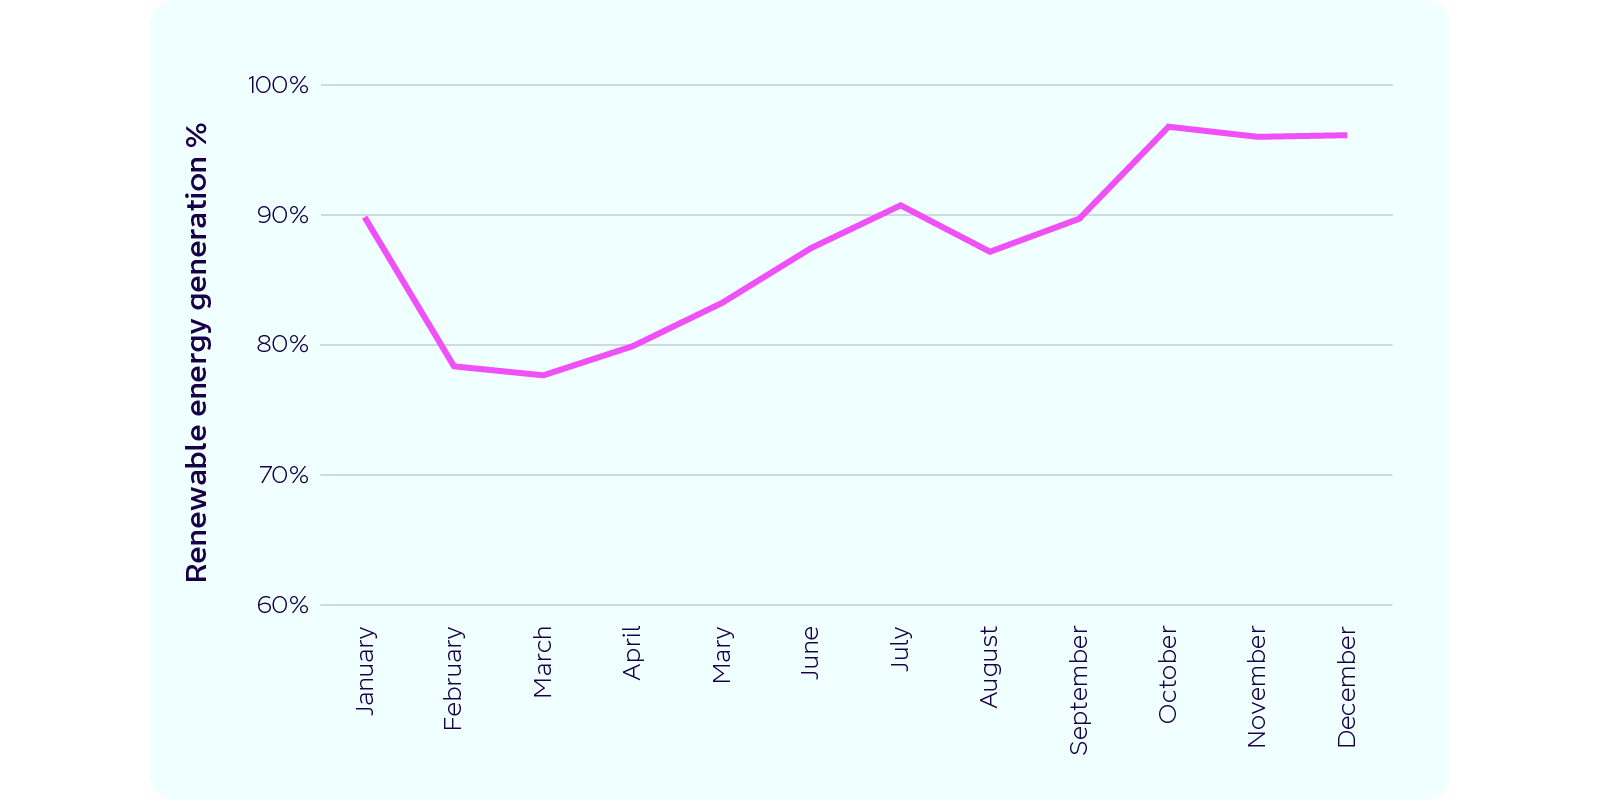
January: 89.8% | February: 78.4% | March: 77.7% | April: 79.9% | May: 83.2% | June: 87.5% | July: 90.7% | August: 87.2% | September: 89.7% | October: 96.8% | November: 96.0% | December: 96.1%
Across the year, renewable sources supplied 88% of New Zealand’s electricity.
March: the lowest renewable month of the year
March was the toughest month, with renewables making up 77.7% of total generation - the lowest monthly average we saw in 2025.
National hydro storage fell to around 77% of the historic mean by the end of the month, contributing to the lowest March-quarter hydro generation since 1987.
With less renewable energy available, the system leaned more heavily on thermal generation to keep supply reliable. Wholesale electricity prices climbed sharply, averaging $279/MWh in March.
It was a clear reminder that while New Zealand’s grid is highly renewable, it is still sensitive to dry conditions.
October: when renewables took the lead
By Spring, the picture had flipped.
October was the strongest month of the year, with renewables averaging 96.8% of total generation and peaking as high as 98% in some weeks. Favourable weather and strong rainfall pushed national hydro storage to around 141% of the historic mean. This resulted in some hydro spill where dams were forced to release excess water that exceeded their storage and generation capacity. The surplus of energy drove wholesale electricity prices down to zero at certain points during the month.
Why did the renewable share vary?
Hydro remains the backbone of New Zealand’s electricity system. When rainfall is low, renewable percentages fall quickly. When lakes are full, renewables dominate the mix.
Wind generation fluctuated through the year, reinforcing the need for complementary technologies that can smooth peaks and troughs. Meanwhile, large scale solar had a breakout year, with generation up 64.2% year-on-year.
Geothermal continued to provide a reliable, low-emissions supply, with output increasing by 6.5% over the year.
Moving forward
2025 showcased both the challenges and wins of New Zealand’s energy generation. Early in the year, low hydro storage and constrained gas supply exposed how tight the system can become. By the end of the year, the grid delivered three consecutive months of renewable generation above 96%.
New Zealand is a leader in renewable energy, and the transition to a more sustainable grid is already underway. If we can encourage new electricity generation to be built, our grid can not only become more sustainable, but customers would benefit from more competitive pricing in the future.
